I have found a way to BOTH discover which node is who (i.e. who has the longer message delay) AND estimate the one way trip delay. While the other answers are correct they are ONLY considering direct clock measurement approached which of course cannot work. However as I am proving here this is only part of the story as here is my working algorithm for the above:
Assume as in real life:
Links of finite bandwidth b
Each node has unique address (e.g. A and B)
Packet size p much smaller than the bandwidth*latency product
Nodes A and B are able to fill the channel
Nodes have a random() function
Each node fills the channel with its own packets (marked A or B respectively) OR forwards the packets it received from other nodes as follows:
Always fill the channel with my own packets except:
if I receive a packet from another node then
   Randomly choose to
          either forward that packet from the other node
          or discard that packet and forward my own packet
Intuitive Explanation
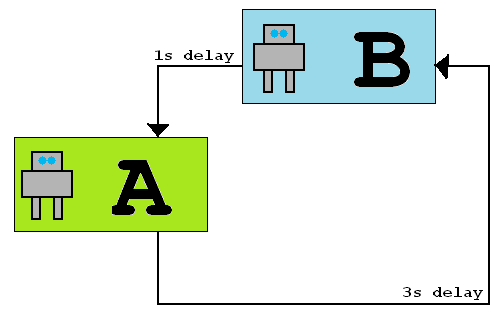
Since A's bandwidth*latency product is higher (because latency is higher) A will manage to have more packets received than B, therefore each Node can know who they are in the diagram.
Furthermore, with enough convergence time of running above algorithm the ratio of packets of A to B will denote the actual ratio of RTT delay of A to B and therefore the desired OTT.
SIMULATION RESULT TRACE
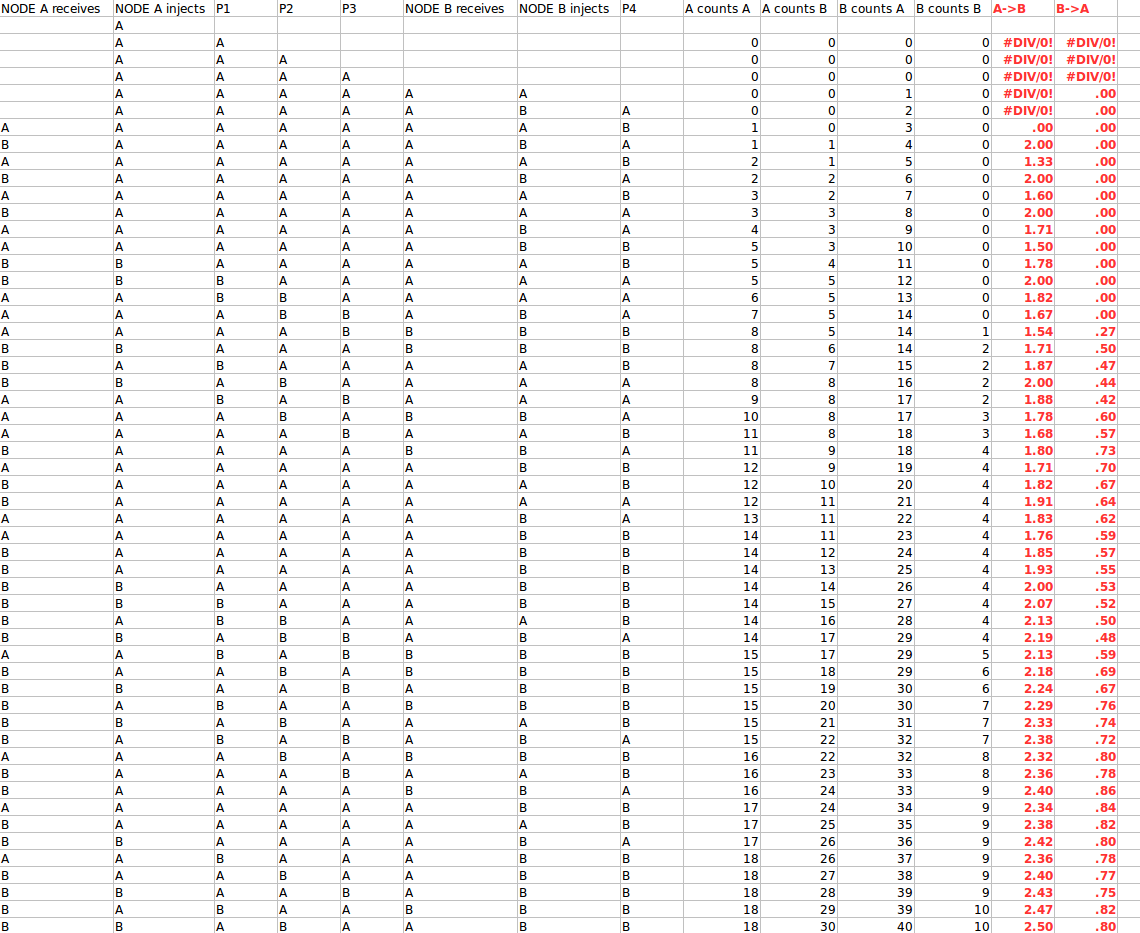
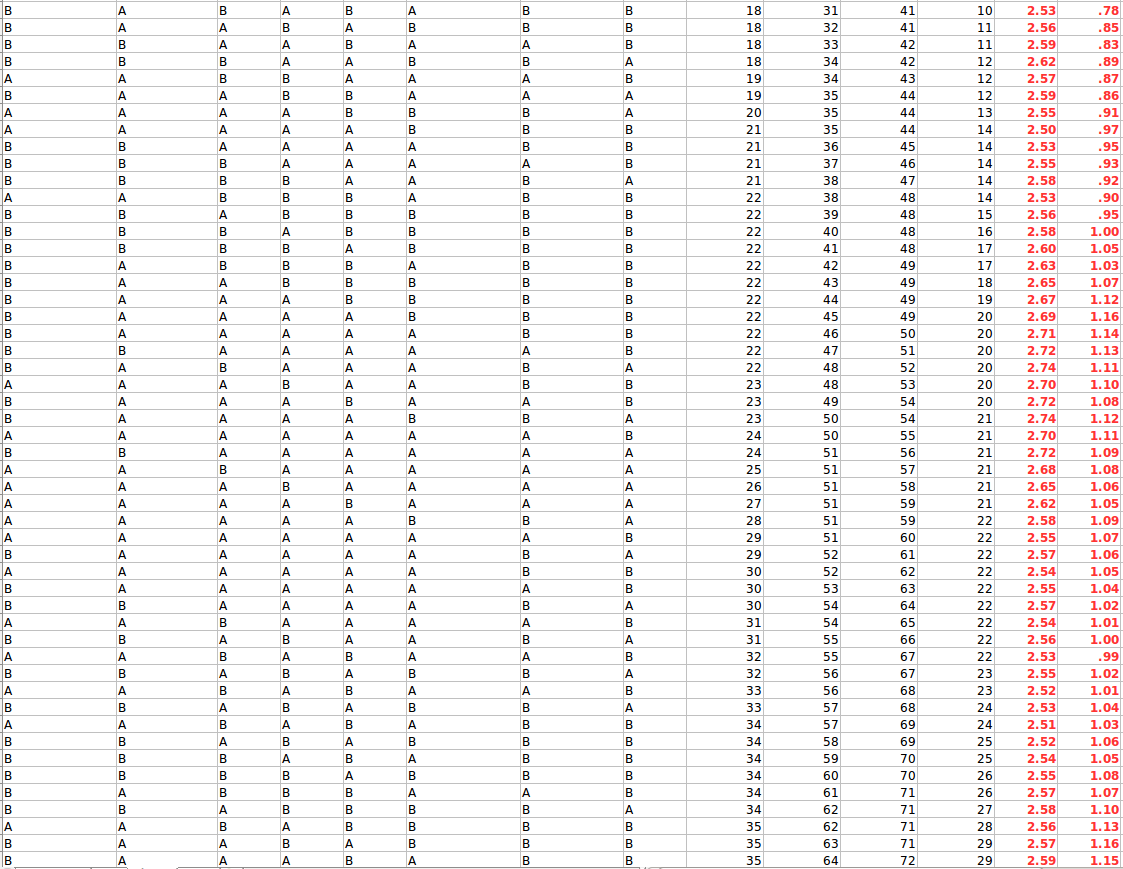
Here is a simulation that proves the above and shows how A successfully converging toward 3 second delay and B converging around 1 second delay:


Explanation of Figures:
Each line represents 1 second of time (packet size is chosen to have 1 second transmission time for clarity).
Note that each node can start the algo at any time not in any particular sequence or time.
The columns are as follows:
NODE A receives : What node A sees in its receiving side (this is also P4 below)
NODE A injects : What node A sends out (note this is A, or randomly A or B)
P1, P2, P3 : The three packets that are in transit (in order) between A and B (1 second transmission means 3 packets are in transit for a latency of 3)
NODE B receives : What B sees in its receiving side (this is P3)
NODE B injects : What B sends out (note this is B, or randomly A or B per algo)
P4 : The packet in transit from B to A (see also P1, P2, P3)
A counts A : What A counts for the A packets it has seen
A counts B : What A counts for the B packets it has seen
B counts A : What B counts for the A packets it has seen
B counts B : What B counts for the B packets it has seen
A->B : The latency that A estimates towards B (ratio of RTT of 4 seconds based on packets seen)
B->A : The latency that B estimates towards A (ratio of RTT of 4 seconds based on packets seen)
As we can see both nodes converge and stay around their true latency (actually we do not see that for A because more seconds are needed to converge but it does converge same behavior as B)
Better filters could converge faster but we can clearly see how they both converge around the correct values for their delays, therefore they can exactly know know their delay (even though I am showing their estimation only for illustration).
Also, even if bandwidths between the links are different the above method could still hold (although one will have to think about it more to be more certain) by using packet pairs to figure out bandwidth estimates and then just apply to the proportion equation above.
Conclusion
We provided an algorithm for both A and B to know their position in the network and know their latency to the other node for the above diagram. We used a network measurement estimation method rather than clock-based approaches which indeed cannot lead to a solution due to recursive clock sync issue.
Note I now edited this answer providing all the simulations because no one would believe me I solved it so far as you can see in the first comments. Hopefully with these results someone can be more convinced and approve to help everyone at least find one error or correctness in this network measurement puzzle!


