I have a certain algorithm which I can run, but I do not have access to its code. Thus, it works as a black box. I would like to now the order of complexity of this algorithm on a certain set of instances, which grow in size as a function of $n$.
Now, I have collected running times from $n = 1$ up to $n = 5000$, which is as far as my computer can go in a reasonable amount of time.
I have plotted my data using Python and I have made some simple regression (exponential, cuadratic, cubic...), but I still can't get to decide which function best fits the algorithm. Obviously, if I try regression with a polynomial of higher degree, I will get a tighter curve, so in case the running time is a polynomial in $n$, I don't know how I could decide which is the one that really fits.
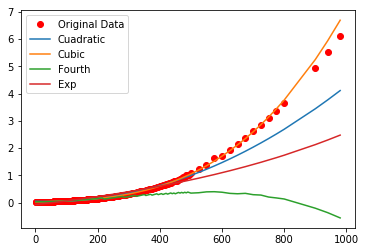
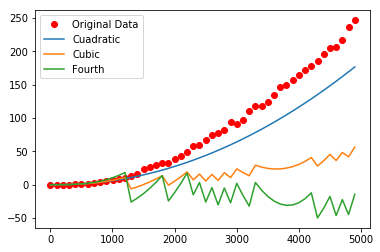
With instances up to $n = 1000$, it seems like the cubic polynomial is the best approximation. However, when I plot the instances up to $n = 5000$, things become less clear (in the second graph I compare the actual running times against the approximations obtained for up to $n =1000$, while the first one compares against the the approximations up to $n = 500$)
(in addition, I feel there is something off with float point calculations, as two of the curves below get really messy)
Any suggestions?
A bit of context: I am working on a particular class of hard Quantified Boolean Formulas (QBF) and I want to test their running times on different available QBF-solvers. These formulas verify a certain interesting property: they have linear size proofs in the QU-resolution proof system. However, QBF-solvers act as block boxes for me, and, altough I can see from data that they do not have the "predicted" linear running times, I would like to know how is the growth in complexity in these particular instances. Particularly, it would be great to give some approximate bound or even confirm that they do not seem to have an exponential growth. Thanks.


