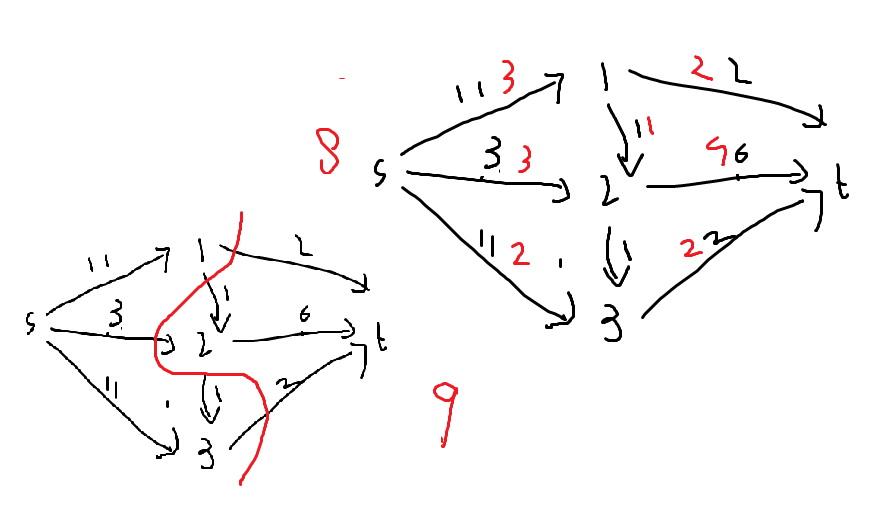
I understand the relation between max flow and min cut, however I made this (simplified) graph, and I cant figure out why max flow seems to be different from my min cut. Im probably overlooking something simple, but I've been staring at this for 10 minutes now...
Can anyone explain what Im missing?

$\begingroup$
$\endgroup$
Add a comment
|
1 Answer
$\begingroup$
$\endgroup$
1
The edge from $2$ to $3$ isn't part of the minimum cut. It's oriented in the wrong direction, from the sink side to the source side, so you can delete it from your cut and there's still no path from $s$ to $t$.
-
$\begingroup$ Thank you! I didn't notice the opposite direction. $\endgroup$– ZouterCommented Jan 22, 2017 at 11:50
